Brief
The brief is as follows.
A fabric manufacturer has asked you to investigate the possibilities involved in using lasers to test the quality of their textile products.
This experiment is in two parts, the first involving finding the wavelength of the laser, the second working from this to find the slit separation of some fabrics.
Conventions
The term order refers to the spots created by a diffraction grating. The 1st order is the first spot from the centre, the 2nd order is the second, and so on. The central dot is called the central bright namely because it is central, and bright. Technically speaking it is the "zeroth" order, although this term is rarely used.
Part 1: Plan
Before I can test the various pieces of fabric with the provided laser, I need to know the laser's wavelength (l). To find it's wavelength I will use a diffraction pattern (generated by a diffraction grating) as is described below.
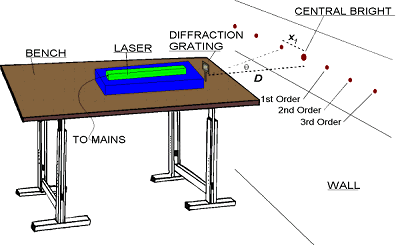
A laser, placed at distance D from the wall, will shine it's monochromatic light through a diffraction grating of 300 lines per mm (d, the centre-centre slit separation, being therefore 1/300 mm). By measuring the distances xn (where n is the order of the dot in question and xn is the distance from the central bright to dot n). I can find the wavelength from the following equation.
| l = |
d sin (tan-1(xn ÷ D))
|n| |
To find the distance xn, I will measure both the shortest distance from the central bright to the dot and the longest distance from the central bright to the dot.

The error is the difference between these two distances (the reason for the dots is explained below in the theory section).
To increase the measuring accuracy, I will affix graph paper to the wall on which the dots are shining and then draw on to it the edges of the spots. I will then measure the distances at our convenience on the table, where I will not have the problems of rulers slipping off the wall and having to crouch to see clearly.
Suitable values of D would range from 1 to 3 metres. The bigger D is, the more accurate the wavelength will be, because x will be bigger too and error will thus be reduced. However, a large spacing between the dots also means that I need a large wall on which to project them.
Hazards
Lasers pose a hazard if used carelessly since they can damage the retina if allowed to shine directly into the eye. There is also the danger of the reflected orders (the grating always produces reflected orders as well as the ones I measure) being looked at since they will be shining back into the room, where other people may be working. One solution is to wear dark protective goggles, however, since the room will be darkened to make the dots more visible (and to reduce the interference - albeit negligible - between the laser and ambient light) wearing dark goggles would have the same effect as looking through two polaroid screens at right angles to each other!
I will therefore merely be careful to not look directly at the reflections or the laser. I will also warn any other people who are in the room at the time.
Theory
Observations
Diffraction gratings are used for measuring wavelengths accurately and to produce spectra. (They have also replaced the prism in much modern spectroscopy). Their usefulness arises from the fact that they give very sharp spectra, most of the incident light being concentrated in certain directions.
![[DIAGRAM:] With one slit you have very broad dispersion of the light, but with each extra slit added you get - superimposed - another more frequent pattern. Finally, with 6 or more slits the effect is that of just a few odd peaks.](1slit.gif)
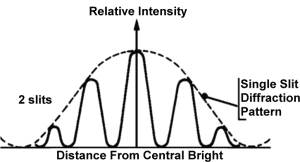
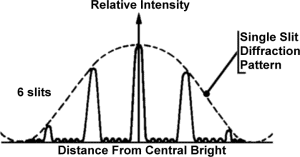
As can be seen in the diagram above, the more slits are added the more pronounced the peaks become, with a fine grating as will be used in this experiment one only gets a few dots over a large area.
A typical pattern for white light shone through a fine grating is shown here.
![[ROYGBIV] [RGV] W [VGR] [VIBGYOR]](colourfringes.gif)
The central bright band is White but on either side of it are bands of colour, called first order spectra, second order spectra, and so on. Each spectrum consists of a series of adjacent images of the filament formed by the constituent colours of white light. These are similar to those given by a prism but instead have the Red light deviated more than the Violet. This is because in prisms the light is dispersed, not diffracted as in diffraction gratings.
In prisms the light with the lowest wavelength (Violet) will have the greatest path change since it is the speed of travel which is reduced. With diffraction the path deviation depends on the required path difference between a bright band (constructive interference) and the next, and since short wavelengths have a shorter required path difference they are deviated less. It follows therefore that in diffraction the spectra will have the reverse direction.
Note that the dispersion increases with order. This is discussed in the errors section.
Basic Concepts
Waves come in several flavours.
Progressive or Travelling waves consist of a disturbance moving from a source to surrounding places as a result of which energy is transferred from one point to another.
Progressive waves have several properties which can be used to describe them. The wavelength of a wave (l) is the distance between two of it's crests (measured in metres). The frequency of a wave (f) is the number of crests which pass a fixed point in the period of one second (the unit of frequency is the Hertz, abbreviation Hz). The speed of a wave (c) is a measure of the distance of a wave which passes a fixed point every second (units: ms-1). For electromagnetic radiation, c has the value 299792459.0ms-1 (±8). This is commonly known as the speed of light, but applies to all electromagnetic radiation (such as radio waves, microwaves, infrared, ultraviolet light and gamma rays). The variables c, f, l are related by the following equation.
c = lf
Waves can also be described by their amplitude, which defines the maximum displacement.
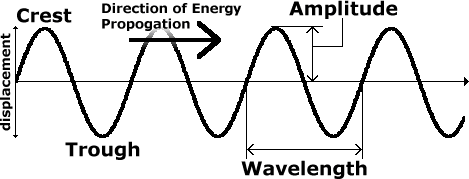
Transverse waves have their direction of propagation perpendicular to the direction associated with their disturbance. Examples of transverse waves are the waves seen on vibrating string and electromagnetic radiation.
Longitudinal Waves
![]()
Longitudinal waves are made of a continuous variation of compression of the medium in which they travel, their direction of travel is the same as their apparent direction of oscillation. Points of low pressure are called rarefactions. The canonical example of a longitudinal wave is sound.
The polarity of a transverse wave is the direction in which the oscillations occur. Light from a laser is completely polarised in that all the transmitted photons oscillate in the same direction. For obvious reasons, longitudinal waves do not have a polarity (they can only oscillate in one direction, that of travel).
A pair of coherent waves have the same wavelength, speed, and polarity. Coherency is a prerequisite for interference.
Interference is an effect which is seen when two (or more) waves cross paths. Interference does not affect the waves themselves, merely the effect the waves have on the surroundings. Diffraction is a side-effect of interference.
Standing waves are not discussed here.
Reasoning
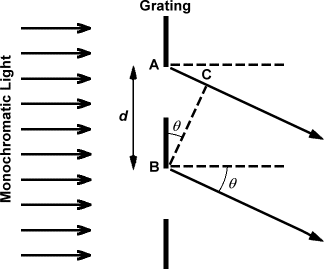
Suppose plane waves of monochromatic light of wavelength l fall on a transmission grating in which the slit separation (also called the grating spacing) is d. Consider wavelets coming from corresponding points A and B on two successive slits and traveling at an angle q to the direction of the incident beam. The path difference AC between the wavelets is d sin q, as it is for all pairs of wavelets from other corresponding points in these two slits and in all pairs of slits in the grating. Whenever light from all the slits has a path difference of an whole number of wavelengths, then there will be reinforcement of the diffracted wavelets and you will see a dot. This occurs when
d sin q = nl
where n is an integer giving the order of the spectrum, and the dot will be seen in the direction q for each value of n. For non-integer values of n the light does not reinforce, and no light can be seen. (Note. This is not exactly the equation I used. Please read the Equations section for more details).
Monochromatic light is used for accuracy since with white light the entire spectrum can be seen and it is more difficult to know where and what to measure.
It is also important that coherent light be used since electromagnetic radiation which is not coherent does not interfere and would therefore not generate a pattern. Using a laser guarantees that the light is coherent (that is to say, of equal wavelength, amplitude and polarity). Another, less reliable, method is to use a single slit before the grating. The single slit acts as a point source of coherent light.
Grating Manufacture
Diffraction Gratings are made by ruling many parallel, equidistant and equally sized lines either on glass or polished metal with a diamond point.
Glass is used for transmission gratings (the lines, which scatter the incident light, and are more or less opaque while the gaps between them let the light through and act as slits). Glass gratings are very expensive and thus cheaper plastic models are now available.
Metal is used in reflection gratings. In these, the lines are again opaque but the unruled parts reflect rather than letting the light through. This type has the advantage that radiation absorbed by transmission grating material can be studied and if it is ruled on a concave spherical surface it focuses the radiation as well as diffracting it and so no lenses are needed.
Fine and coarse gratings
A coarse grating forms many more orders of spectra, closer together, than a fine grating. For this reason, using finer gratings results in more accurate measurements of l (the wavelength). The finest commonly available grating size (certainly at my school) is 300 lines per mm.
Lasers
A laser (which stands for Light Amplification by the Stimulated Emission of Radiation) normally consists of a long narrow tube with a fully reflective mirror at one end and a partially reflective mirror at the other. Because the size of a laser is greater than the diameter of a single photon, the beam is also larger than a single photon. This is the reason for the dot, and is why it is impossible not to have a margin of error.
Lasers basically operate by absorbing non-coherent radiation from, for example, a xenon arc lamp and re-emitting some of this energy in the form of a coherent, monochromatic beam of light of great intensity. Depending on the material used to produce the laser action, the resulting beam may either be pulsed (as in the solid-state ruby laser) or continuous (as in the helium-neon gas laser). We are going to use a helium-neon gas laser. A continuous beam provides much smaller output powers than the peak values attained during pulse operation.
When in an electromagnetic field, atoms of a material may absorb and emit photons, and thermal equilibrium is reached when as many photons per second are absorbed as emitted . In this situation, there are far more atoms in the ground state (energy E0) than in excited states (energies E1, E2, and so on) and such a distribution is called a normal population.
In certain materials, it is possible to get an inversion of this population using a technique known as optical pumping. The atoms are first optically excited, for example by using light focused from a xenon arc lamp, to the energy state E2. Almost immediately they 'decay' or re-emit energy and reach the state E1. The latter is a metastable state (i.e. decay from such a state is more delayed) and so an accumulation of atoms in this state occurs giving a population inversion. This is just what is required for laser action. If a photon of energy (E1 - E2) is now introduced into to the system, the excited atoms are stimulated to return to the ground state by emitting photons of precisely this energy (E1 - E2). Since all emitted photons are in phase, the resulting beam of light is not only monochromatic but also very coherent and extremely intense.
Amplification may be increased by using mirrors (or silvered surfaces of the crystal in the solid-state laser) at the ends of the material. The photons thus suffer multiple reflections within the system stimulating the emission of more and more photons during their passage. A very powerful and narrow beam of light eventually emerges through a section at one end which is only partially silvered.
Prediction
The wavelength I am expecting is in the range of 3.5×10⁻⁷m to 7.5×10⁻⁷m (visible light). It should be near the larger side of the value (between 6.0×10⁻⁷m and 7.5×10⁻⁷m, hopefully), since this is a red laser. This will rather depend on the accuracy of the measurements!
I did not find any value printed on the laser, nor could I find any of the related literature. My values come from previous work on the electromagnetic spectrum and are generally recognized in the scientific community as the range of wavelengths of visible light.
Results
Constants
D=1.847m (± 0.005m)
d=(1/300)×10-3m (no error was printed on the grating, so I will assume it was perfect, thus ± 0)
Diffraction Grating Results
Below are given the results, as collected. In this table, negative and positive values for n represent the left hand side and right hand side of the central bright respectively.
The wavelength can also be calculated directly from the data:
(sin(tan-1(x4/D)) - sin(tan-1(x1/D))) / ((4/d)-(1/d))
Biggest Error:
(sin(tan-1(x4/(D+0.005))) - sin(tan-1(x1/(D-0.005)))) / ((4/d)-(1/d))
Smallest Error:
(sin(tan-1(x4/(D-0.005))) - sin(tan-1(x1/(D+0.005)))) / ((4/d)-(1/d))
| n | near xn (m) |
far xn (m) |
centre xn (m) |
error xn (m) |
error xn (%) |
|---|---|---|---|---|---|
| -1 | 0.3495 | 0.3595 | 0.3545 | 0.0100 | 2.82 |
| 1 | 0.3495 | 0.3585 | 0.3540 | 0.0090 | 2.54 |
| 2 | 0.7415 | 0.7505 | 0.7460 | 0.0090 | 1.21 |
| -2 | 0.7475 | 0.7575 | 0.7525 | 0.0100 | 1.33 |
| 3 | 1.2535 | 1.2645 | 1.2590 | 0.0110 | 0.87 |
| -3 | 1.2625 | 1.2755 | 1.2690 | 0.0130 | 1.02 |
| 4 | 2.1115 | 2.1245 | 2.1180 | 0.0130 | 0.61 |
| -4 | 2.1015 | 2.1225 | 2.1120 | 0.0210 | 0.99 |
I then collapsed these results into the set below by taking the minimum near values and maximum far values for each order of n. This (obviously) increases the error for each order but this is needed since I must take into account the orders on both sides of the central bright. The combined (collapsed) results are as follows:
| n | near xn (m) |
far xn (m) |
centre xn (m) |
error xn (m) |
error xn (%) |
|---|---|---|---|---|---|
| 1 | 0.3495 | 0.3595 | 0.3545 | 0.0100 | 2.82 |
| 2 | 0.7415 | 0.7575 | 0.7495 | 0.0160 | 2.13 |
| 3 | 1.2535 | 1.2755 | 1.2645 | 0.0220 | 1.74 |
| 4 | 2.1015 | 2.1245 | 2.1130 | 0.0230 | 1.09 |
By plotting "|n| ÷ d" on the x axis and "sin (tan-1(xn ÷ D))" on the y axis, I get the gradient as l, which is what I want (this is a simple rearrangement of the equation given in the equations section below, to get it into the form y = mx + c form). The attached graph plots the data in this fashion.
I get l=6.3×10 -7m, ± 0.127×10⁻⁷m. Note that this is within my predicated range.
Errors
The main sources of error are the distance between the laser and the wall, and the size of the dots. The reason for the dots is given above, in the Theory section. There is also a further enlargement of the dots, due to attenuation as it passes through the air. This experiment would have been more accurate if executed in a vacuum.
The dots on the extreme edges were also larger than they needed to be since the light is spread out - it is hitting the surface (the wall) at an angle. This is a concept similar to that of the sun having a lesser heating effect on the earth nearer the poles than at the equator.

If you examine the graph closely you will notice that there are no error bars on the horizontal axis. This is because there is no error in n, and I am assuming there is no error in the grating spacing d.
The maximum and minimum gradients on the line were very close together. My biggest value for the gradient was 6.335×10 -7m and my smallest was 6.208×10 -7m. This makes my error ± 0.127×10⁻⁷m.
I did not draw the two best fit gradients on the graph, since that would not have been accurate enough. I used the full accuracy of the computer to calculate the error.
The error is very small, showing both that the technique was appropriate and that the experiment was well carried out.
Equations
Note how I used
| l = |
d sin (tan-1(xn ÷ D))
|n| |
and not
| l = |
d sin q
|n| |
The (tan-1(xn ÷ D)) replaces the immeasurable q simply to ease matters: it is clearly visible from the first diagram (in the plan section) that tan q = xn ÷ D
Part Two: Application

Having found the wavelength of the laser, one can theoretically use this information to find the spacing of a grating, such as a gauze or lace.
One can use this in a production line, as a technique of quality control. This is because the spacing of individual fabric fibres should be constant.
I tried multiple fabrics, but none produced a pattern. This is unfortunate, as it means that the idea is not practical! At least, not for fabrics. However, it occurred to me that there may be uses other than fabrics, and so I tried a wire gauze. Thankfully, it did produce a pattern!
It is my belief that the textiles were either too flimsy, too widely spaced or simply too irregular to produce diffraction. One of the pieces of lace did once produce something, but the pattern was very irregular and in fact later I could not reproduce it.
Other possible causes of the problem are that the thread was not of uniform thickness - if the spacing or the thread thickness is non-uniform then diffraction is limited to non-existent (for reasons similar to those requiring coherent light).
Calculations for the Wire Gauze
| Order | Near m | Far m | Centre m | d m |
|---|---|---|---|---|
| 1 | 0.019 | 0.012 | 0.0155 | 8.694×10⁻⁵ |
| 1 | 0.021 | 0.013 | 0.017 | 7.927×10⁻⁵ |
| 1 | 0.014 | 0.022 | 0.018 | 7.487×10⁻⁵ |
| 1 | 0.012 | 0.02 | 0.016 | 8.423×10⁻⁵ |
| 1 | AVERAGE: | 0.016625 | 8.106×10⁻⁵ | |
| 2 | 0.036 | 0.029 | 0.0325 | 8.294×10⁻⁵ |
| 2 | 0.029 | 0.035 | 0.032 | 8.423×10⁻⁵ |
| 2 | 0.038 | 0.035 | 0.0365 | 7.385×10⁻⁵ |
| 2 | 0.036 | 0.029 | 0.0325 | 8.294×10⁻⁵ |
| 2 | AVERAGE: | 0.033375 | 8.076×10⁻⁵ | |
| 3 | 0.052 | 0.046 | 0.049 | 8.253×10⁻⁵ |
| 3 | 0.045 | 0.054 | 0.0495 | 8.169×10⁻⁵ |
| 3 | 0.055 | 0.052 | 0.0535 | 7.559×10⁻⁵ |
| 3 | 0.052 | 0.046 | 0.049 | 8.253×10⁻⁵ |
| 3 | AVERAGE: | 0.05025 | 8.047×10⁻⁵ | |
| 4 | 0.068 | 0.061 | 0.0645 | 8.361×10⁻⁵ |
| 4 | 0.07 | 0.062 | 0.066 | 8.171×10⁻⁵ |
| 4 | 0.068 | 0.061 | 0.0645 | 8.361×10⁻⁵ |
| 4 | 0.07 | 0.068 | 0.069 | 7.816×10⁻⁵ |
| 4 | AVERAGE: | 0.066 | 8.171×10⁻⁵ | |
| GRAND AVERAGE | 8.1×10⁻⁵ m | |||
The measurements indicate that the gauze had a separation of about 8×10⁻⁵ m, or 0.08mm. (Note - I have not evaluated d in the x and y directions separately since this gauze was - supposedly - symmetric). The data also indicates various problems that were present, in that the pattern wasn't exactly symmetric. Depending on the requirements of the factory, the piece could either be discarded and recycled, or passed onwards either towards the packaging department or straight into the next step of manufacture.
Note
This set of readings were done on a different workbench, and so in this case D was actually 2.14m.
The calculation is quite simple, and is as follows:
| d = |
|n| l
d sin (tan-1(xn ÷ D)) |
This indicates that it is quite possible to use this sort of technique as a kind of quality control. The equipment can be easily automated, the calculation requires no special considerations, and the limits can be easily set (for example, a system could be configured whereby deviation of more than 1% from the norm results in automatic recycling).
Further Research
Further research, such as into exactly why the textiles didn't generate patterns, would be nice. Also, if an automated system was built, the laser need not contend itself with merely the visible part of the spectrum, since detectors could be made for any form of light. In fact, light need not even be a limit - electron diffraction may be more suitable. These are all things which companies may want to examine in designing or commissioning this sort of equipment.